WEEKLY LETTER · 18 OCT – 24 OCT 2026
Market overview
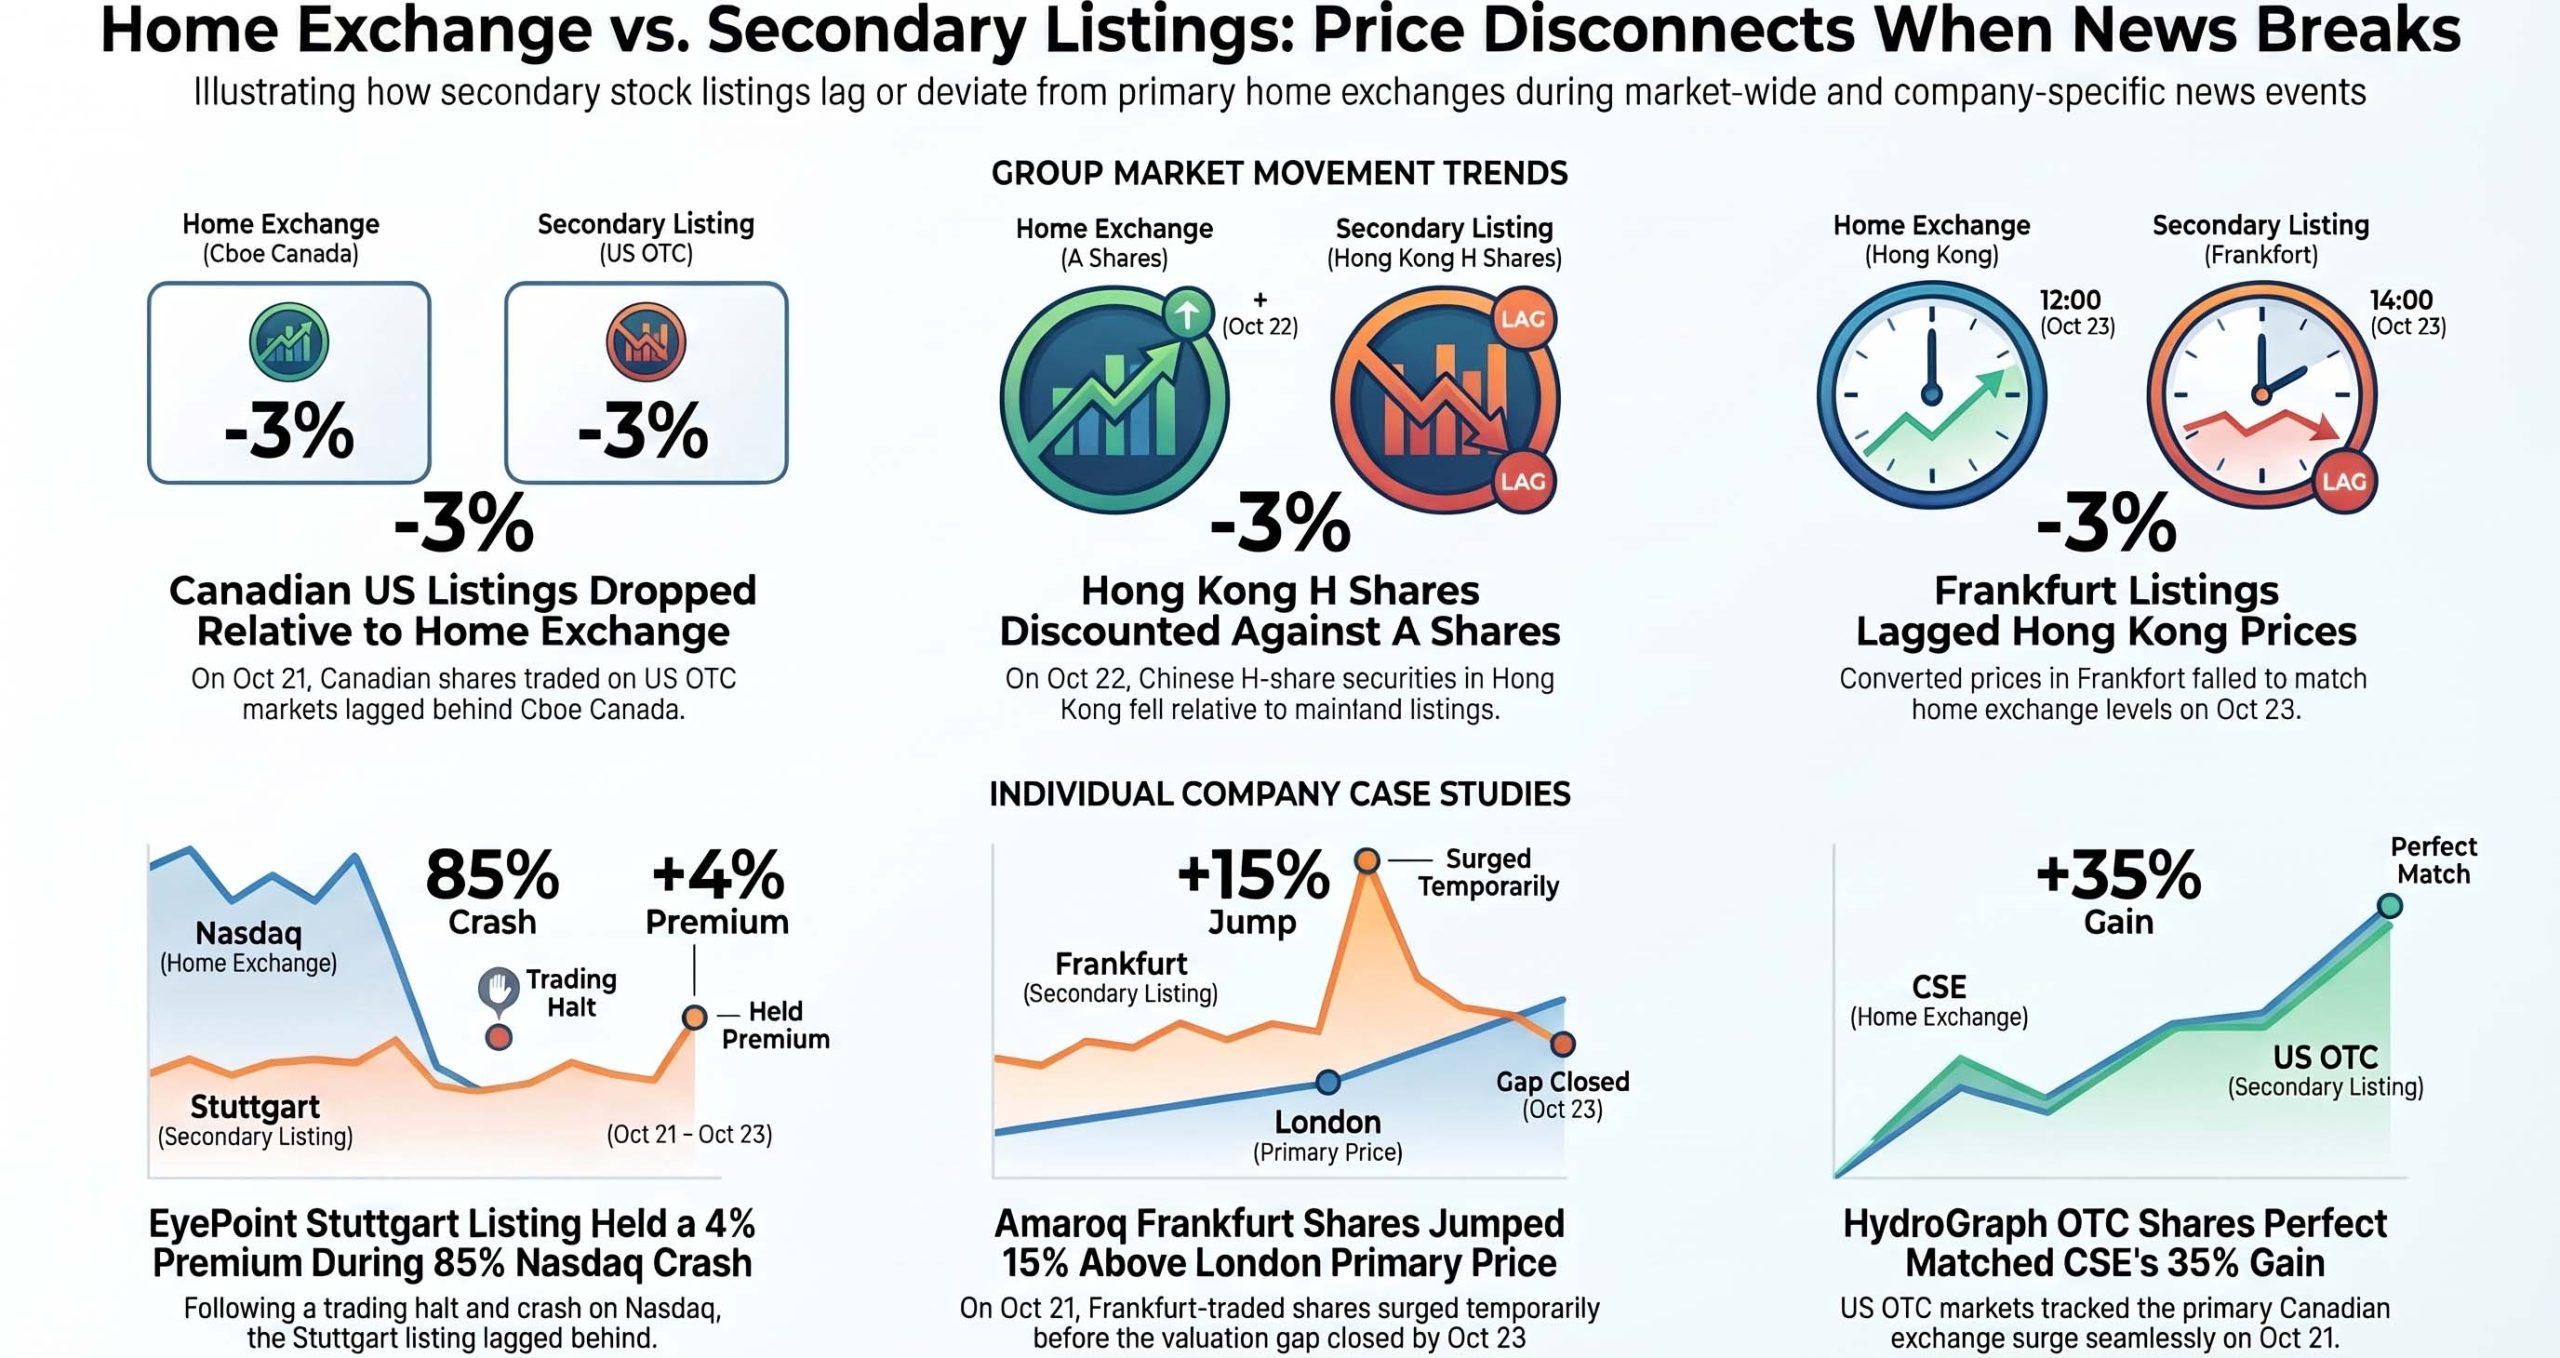
How closely a share on a second exchange follows its home exchange showed up this week first in whole groups. On 21 Oct, the US shares of Canadian companies listed on Cboe Canada, mostly traded on the OTC market rather than a major exchange, became about 3% cheaper on average relative to their home exchange. On 22 Oct it was the turn of H shares – the Hong Kong securities of Chinese companies that are also listed as A shares in Shanghai or Shenzhen: against those A shares they became about 3% cheaper on average. On 23 Oct the Frankfurt listings of Hong Kong companies followed, although their converted price ought to match the one in Hong Kong; they too became about 3% cheaper on average relative to their home exchange. Each time, almost the whole group moved together.
Observations
In the market overview, whole groups moved at once. It is different when news hits a single company: then it becomes clear whether the share on the second exchange – in Germany, for example, in Stuttgart or Frankfurt – keeps pace. This week offered three examples.
−85%
EyePoint on Nasdaq · 19 Oct
+35%
HydroGraph on the CSE · 21 Oct
−15%
Glass House on Cboe Canada · 21 Oct
EyePoint was hit hardest. On 19 Oct trading in the shares was suspended because news was pending; that same day the price on the home exchange, Nasdaq in New York, fell by about 85%. The Stuttgart listing did not quite keep pace: relative to Nasdaq it became about 4% more expensive on the same day, and the gap was still there on 23 Oct.
HydroGraph Clean Power was a smooth case. On 21 Oct, the day of a company update on its path towards first commercial orders, the price on its Canadian home exchange, the CSE, rose by about 35%, and the shares traded on the US OTC market followed to the same extent.
At Glass House Brands, an analyst turned markedly more cautious on 20 Oct. On 21 Oct the price on the home exchange, Cboe Canada, fell by about 15%; relative to that, the Frankfurt shares became about 3% more expensive on the same day. By 22 Oct the gap had partly narrowed.
EYEPOINT INC. – TECHNICAL PICTURE
−89.6% vs. 50-day line · RSI 16 · Results 4 Nov
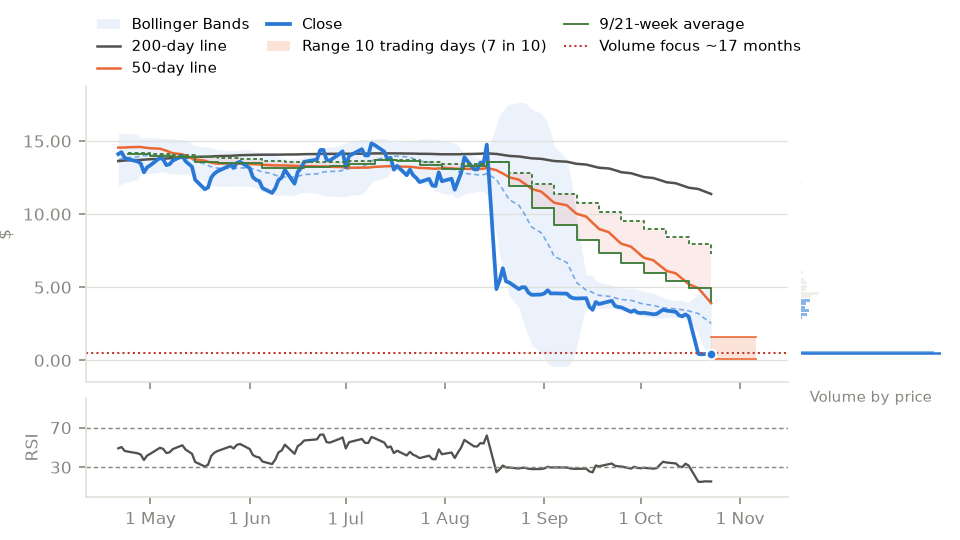
After the slump the share closed on 23 Oct 89.6% below its 50-day line – the average price of the last 50 trading days, which many investors use to judge the direction of the trend. Over the last five days, 24.7 times the usual volume changed hands. The RSI, which measures on a scale from 0 to 100 how one-sided recent price moves have been, stands at 16 – a level considered “oversold”. Quarterly results are due on 4 Nov.
HYDROGRAPH CLEAN POWER – TECHNICAL PICTURE
−29.9% vs. 50-day line · ADX 43
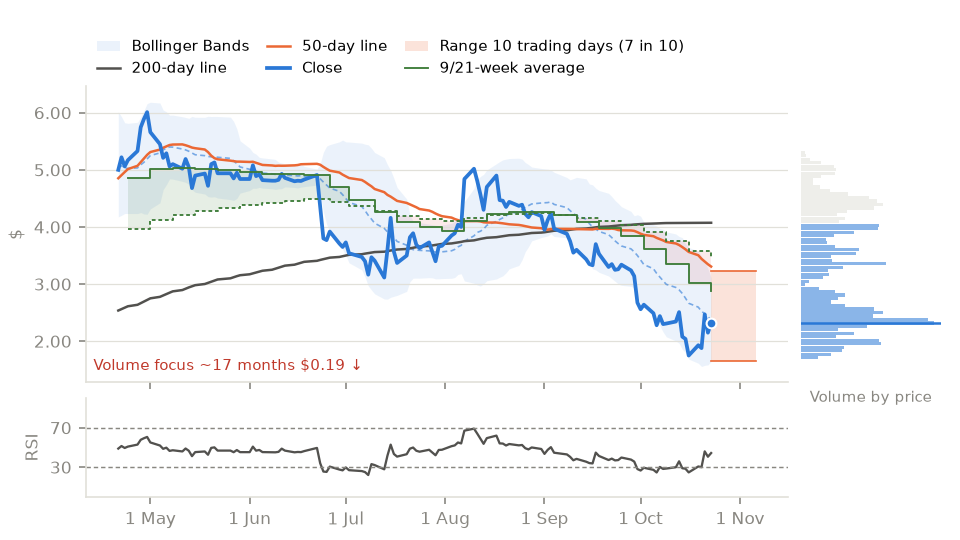
On 23 Oct HydroGraph closed exactly at the price at which most trading took place over the last three months, as the volume profile, which breaks turnover down by price, shows. Despite the jump on 21 Oct, the price is 29.9% below its 50-day line. The ADX, which measures how pronounced a trend is, stands at 43: a clear downward trend.
GLASS HOUSE BRANDS INC. – TECHNICAL PICTURE
−69.8% vs. 50-day line · −76.6% vs. 200-day line · RSI 9
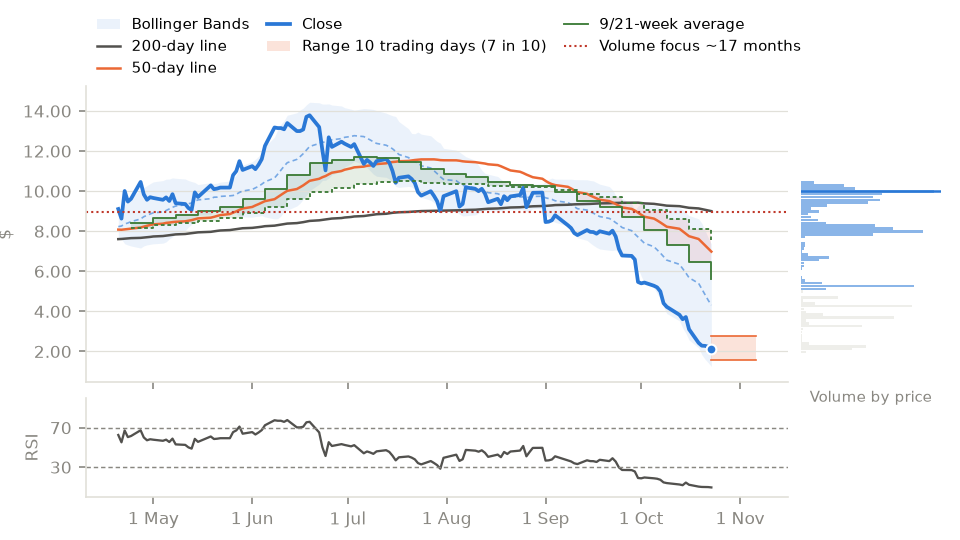
Glass House closed on 23 Oct 69.8% below its 50-day line and 76.6% below its falling 200-day line. The RSI is 9; below 30 a share is considered “oversold”. Looking back: across the shares in this letter, this situation occurred 16 times since October 2021 during a trend in the same direction; 10 trading days later the price was on average 3.1% lower, less than on an average day (2.3% higher) – past patterns need not repeat.
Notable cases
Amaroq: briefly much dearer in Frankfurt
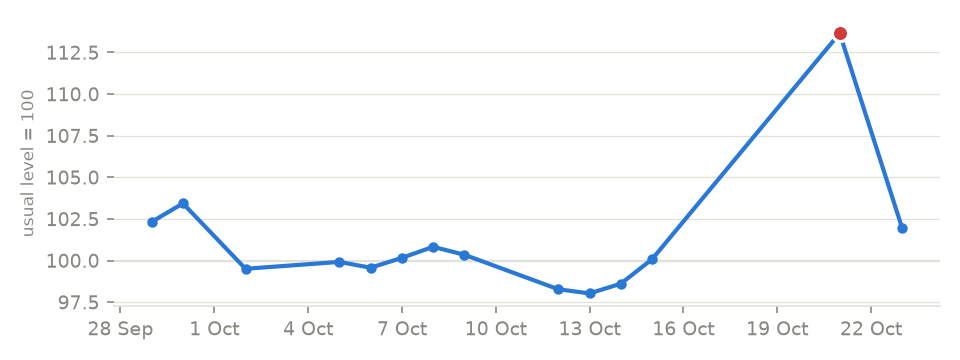
On 21 Oct, Amaroq’s Frankfurt-traded shares were about 15% more expensive than usual relative to the price on the home exchange in London. For other companies from London, the ratio to the home exchange barely changed. By 23 Oct the gap had largely closed again.
Technical picture: figures as of the week’s last closing price. They describe where the price stands and are neither a forecast nor a recommendation.
Follow the strategy: wikifolio | eToro | Collective2
Conflicts of interest. The publisher of this letter discloses the following existing and potential conflicts of interest:
- The publisher holds, or may hold, positions in the financial instruments discussed — either directly or through the model portfolios he manages.
- The publisher runs model portfolios and trading strategies on the platforms of social trading providers (wikifolio / eToro / Collective2) and receives performance-based or volume-based compensation from those platforms in return. Increased attention for the securities discussed may indirectly affect this compensation.
- The publisher uses Fund Seeder for the independent verification of the track record and receives no compensation for publishing there. The platform also serves as a selection channel for capital allocations by third parties.
- The publisher offers paid subscriptions to trading signals via the social trading providers.
- The publisher receives no benefits from the companies discussed and has no business relationship with them.
Disclaimer.
All content published in this letter is provided for general information purposes only and constitutes neither investment advice, nor investment broking, nor an invitation to buy or sell securities or other financial instruments. The content does not take into account the individual investment objectives, financial situation, knowledge and experience, or investment horizon of any individual reader. Before making any investment decision, readers are advised to conduct their own research and, where appropriate, to obtain independent, licensed investment advice. The publisher holds no authorisation from BaFin (the German Federal Financial Supervisory Authority) to provide financial services, and does not provide such services.
Investing in equities and other financial instruments involves substantial risk, up to and including total loss of the capital invested. Past performance, backtested results, and forecasts are not a reliable indicator of future performance. In particular:
- Share prices may be subject to considerable fluctuation.
- Investments denominated in foreign currencies carry an additional currency risk.
Every investment decision is made at the reader’s own risk and on their own responsibility.
The content of this letter is prepared with the greatest possible care. However, no warranty is given as to the accuracy, completeness, or currency of that content — in particular with regard to financial metrics, estimates, and forecasts. Liability for financial loss arising from the use or non-use of the information provided, or from investment decisions based on it, is excluded except in cases of intent or gross negligence on the part of the publisher. Mandatory statutory liability provisions remain unaffected.
This English version is provided for convenience only. The legally binding version is the German disclaimer.
Full disclaimer: fuchsinvest.com/disclaimer/
Publisher: Alec Fuchs – fuchsinvest.com